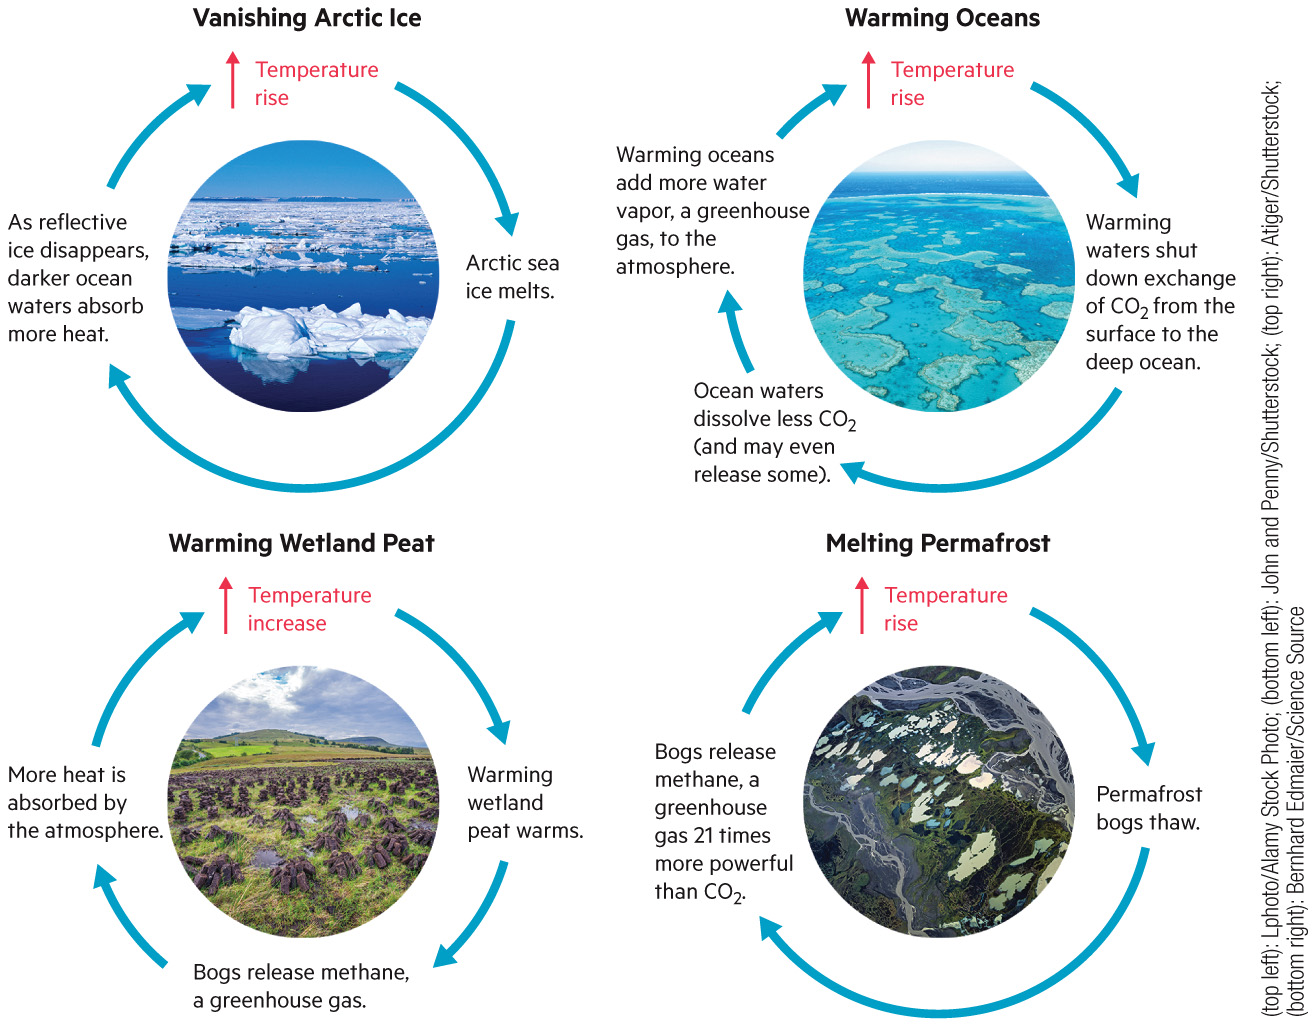
Here's what's on deck. Check Canvas for full instructions and submission links.
Answer on your laptop. Responses are anonymous.
Answer both on your laptop. Responses are anonymous, and results stay hidden until the reveal.
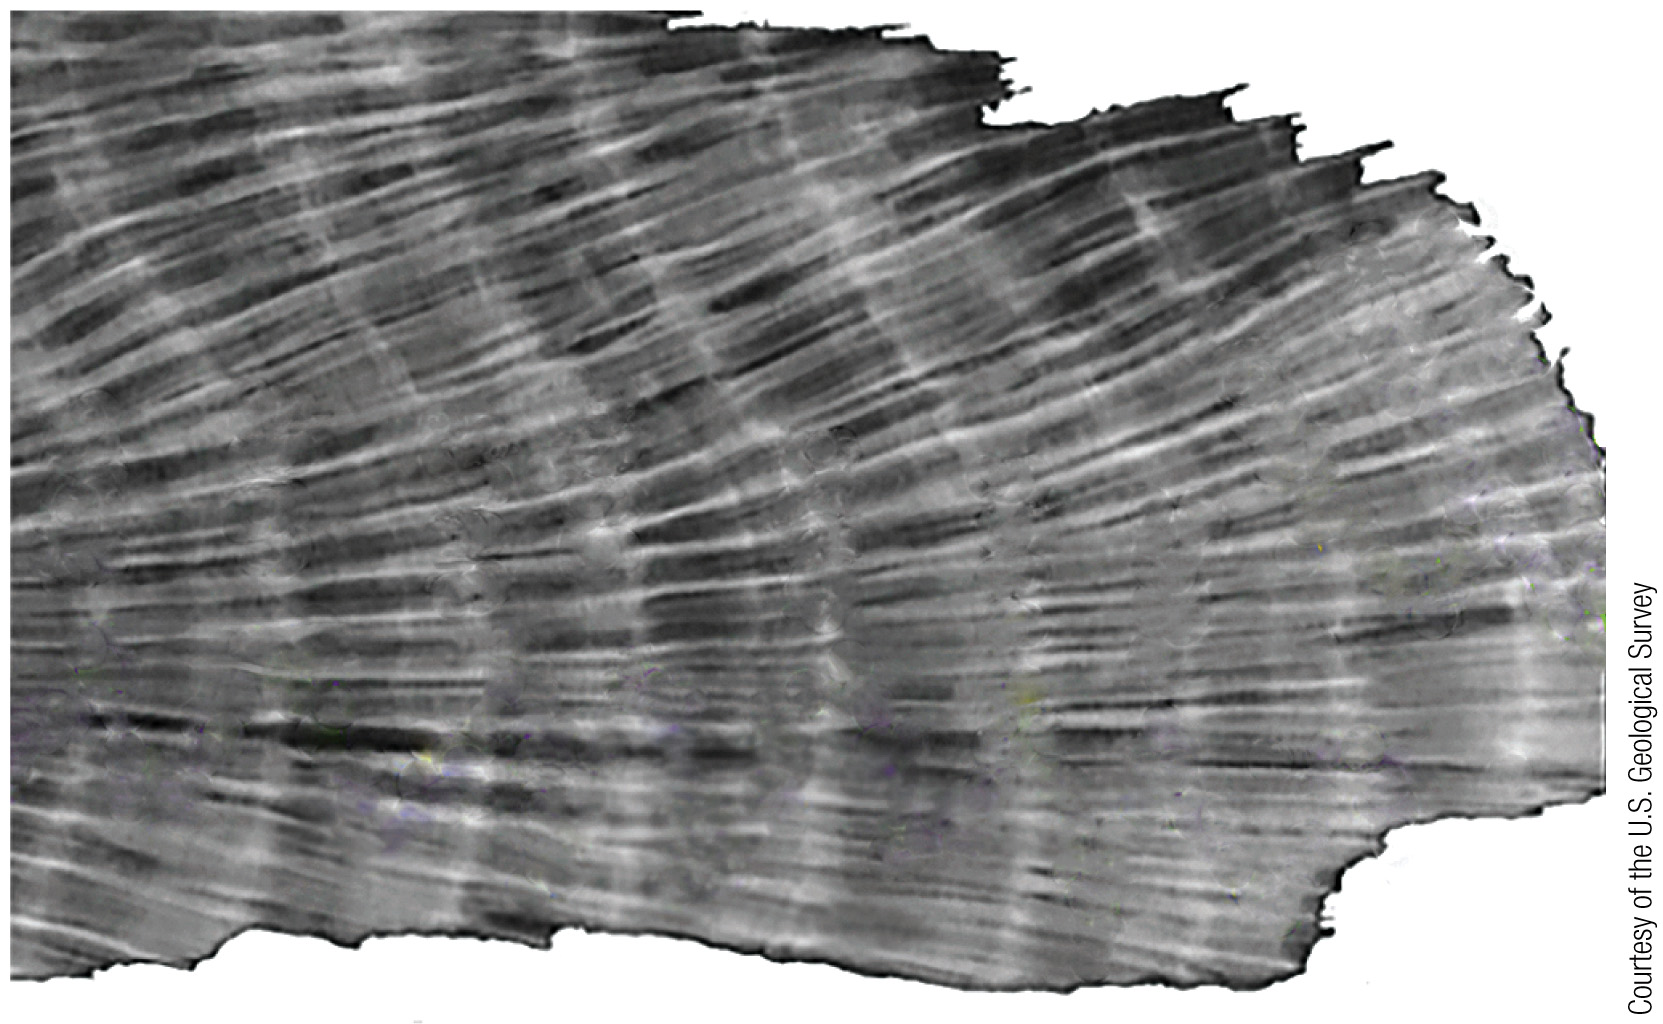
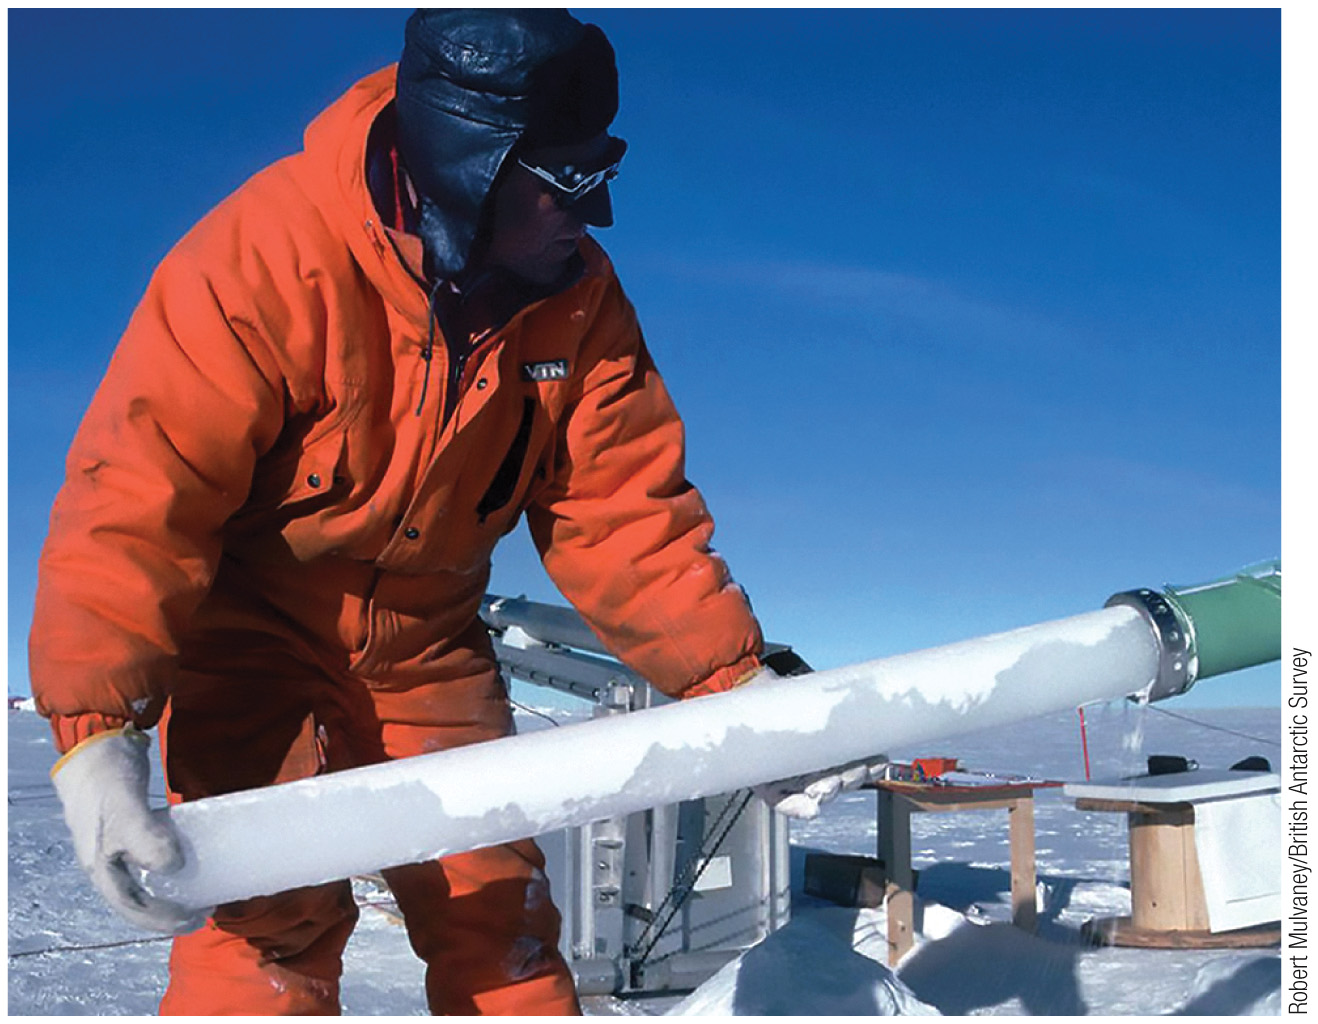
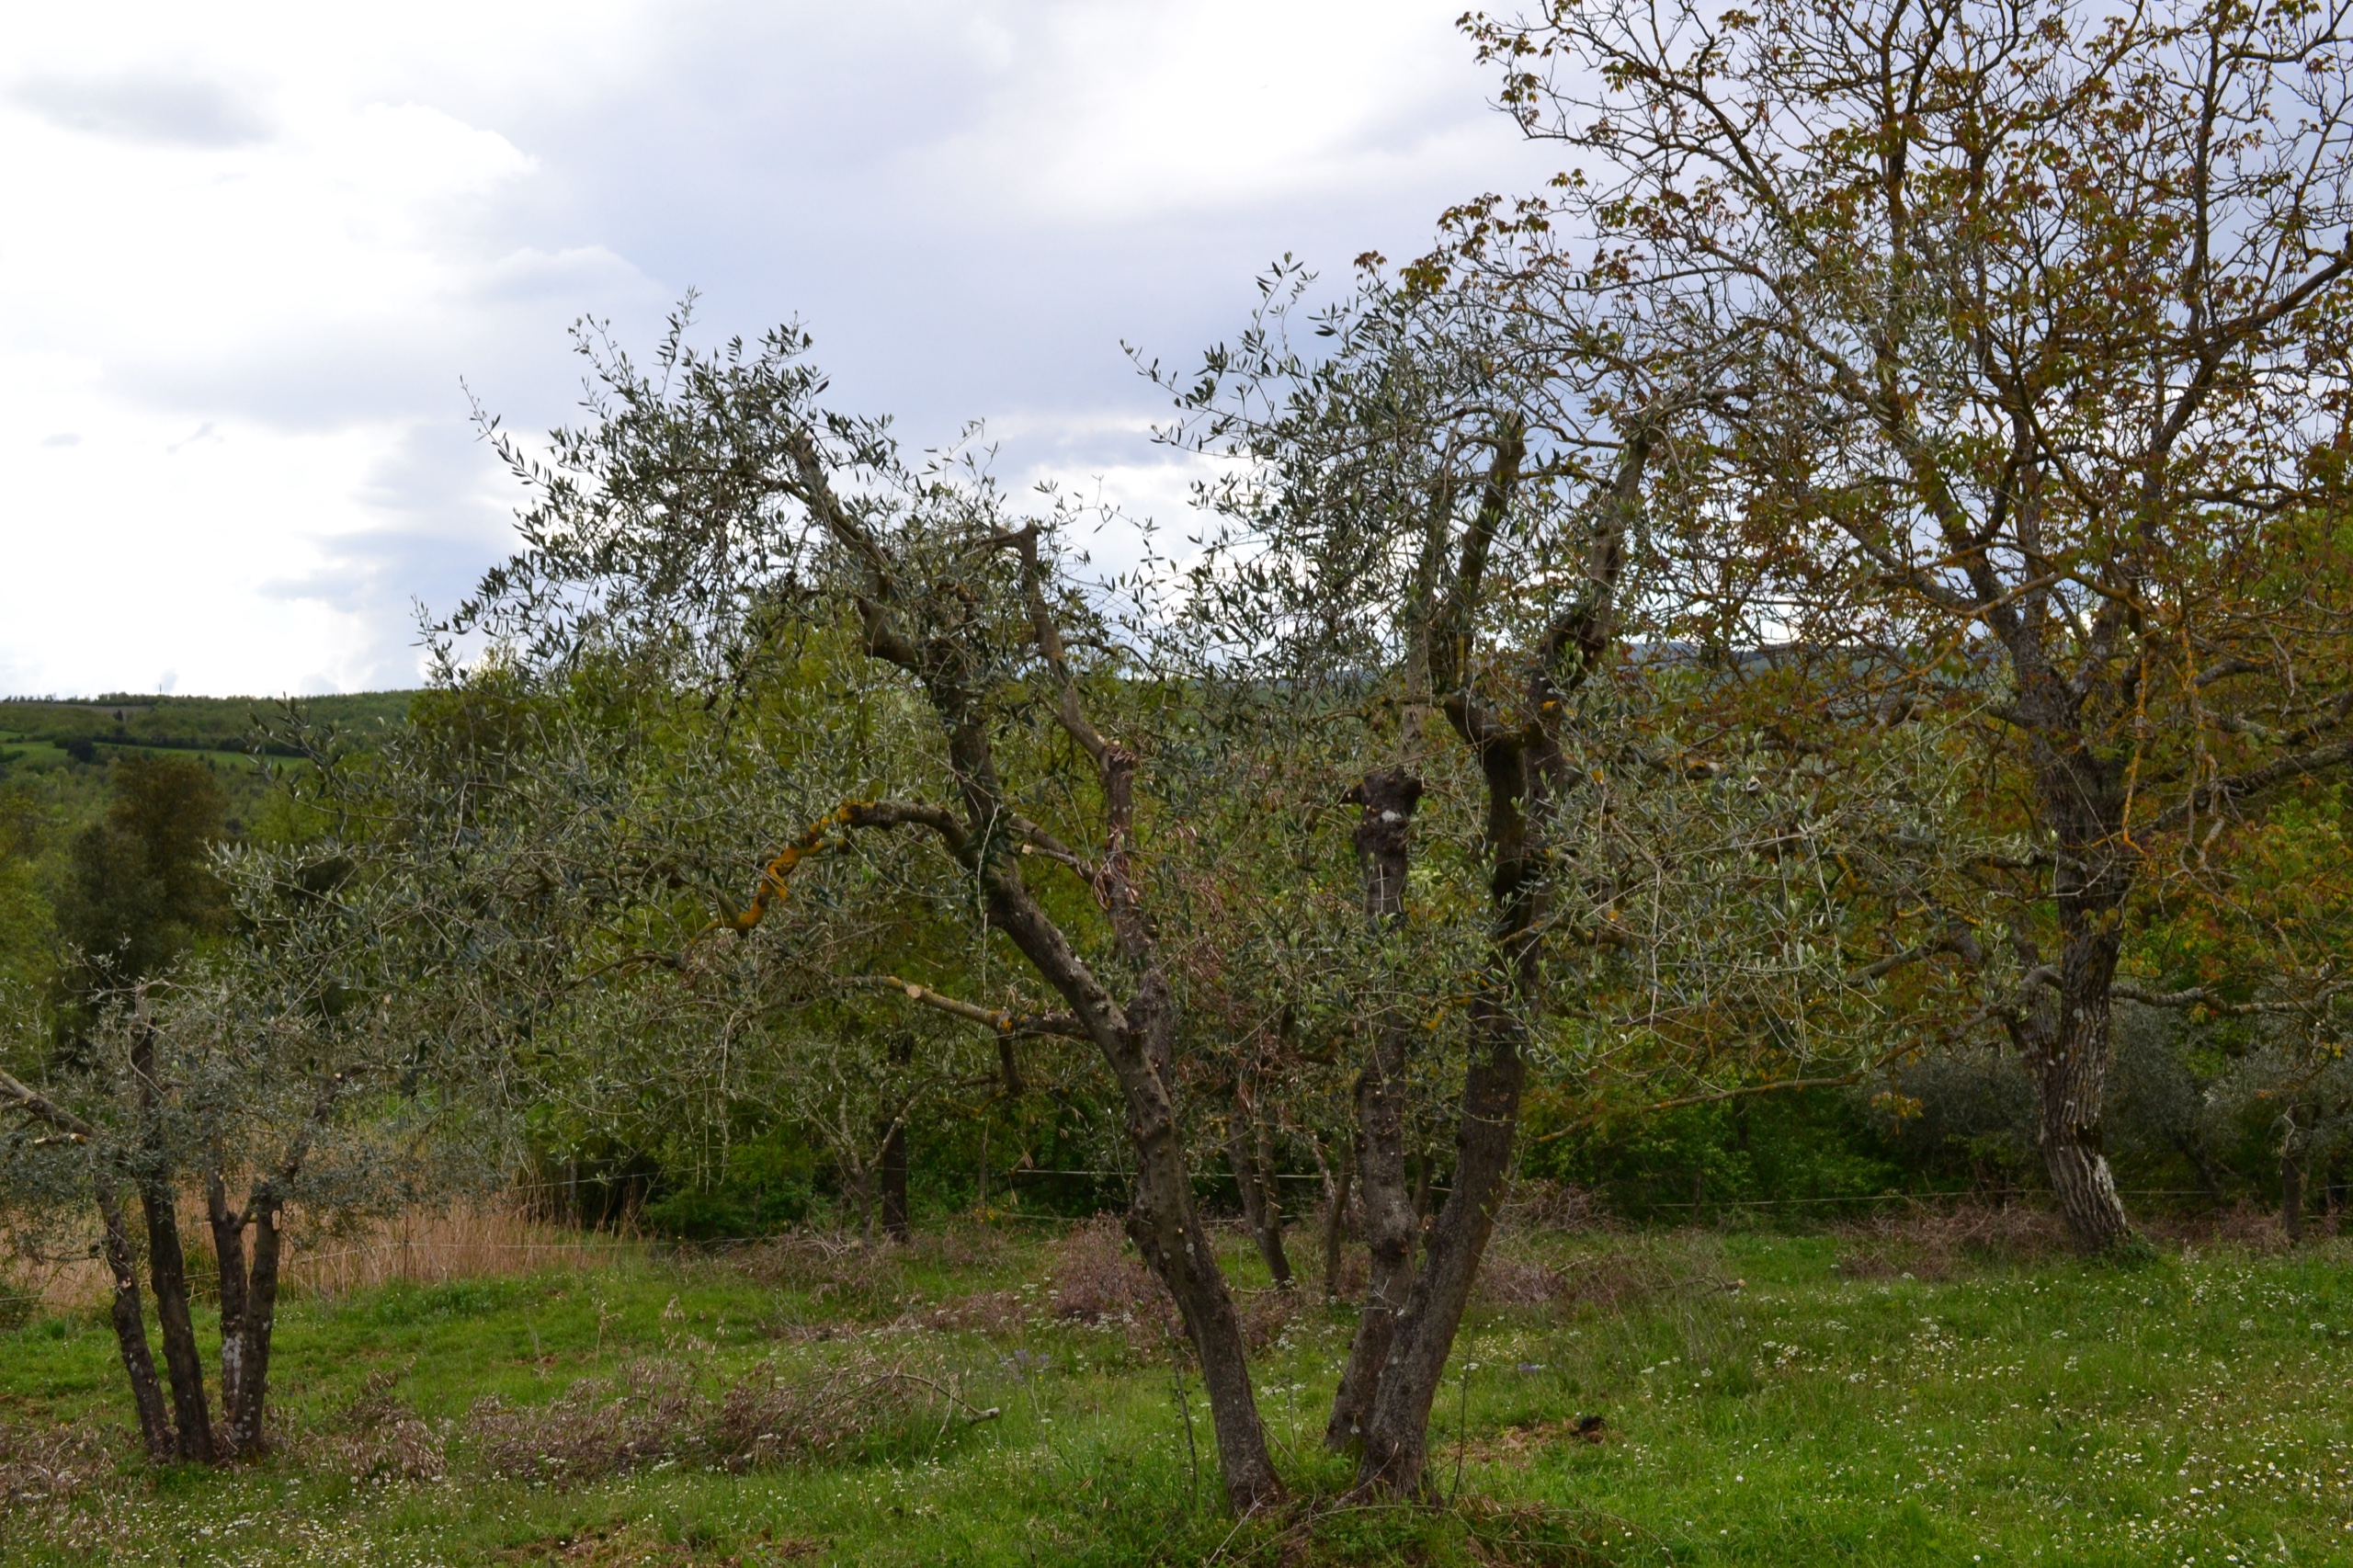
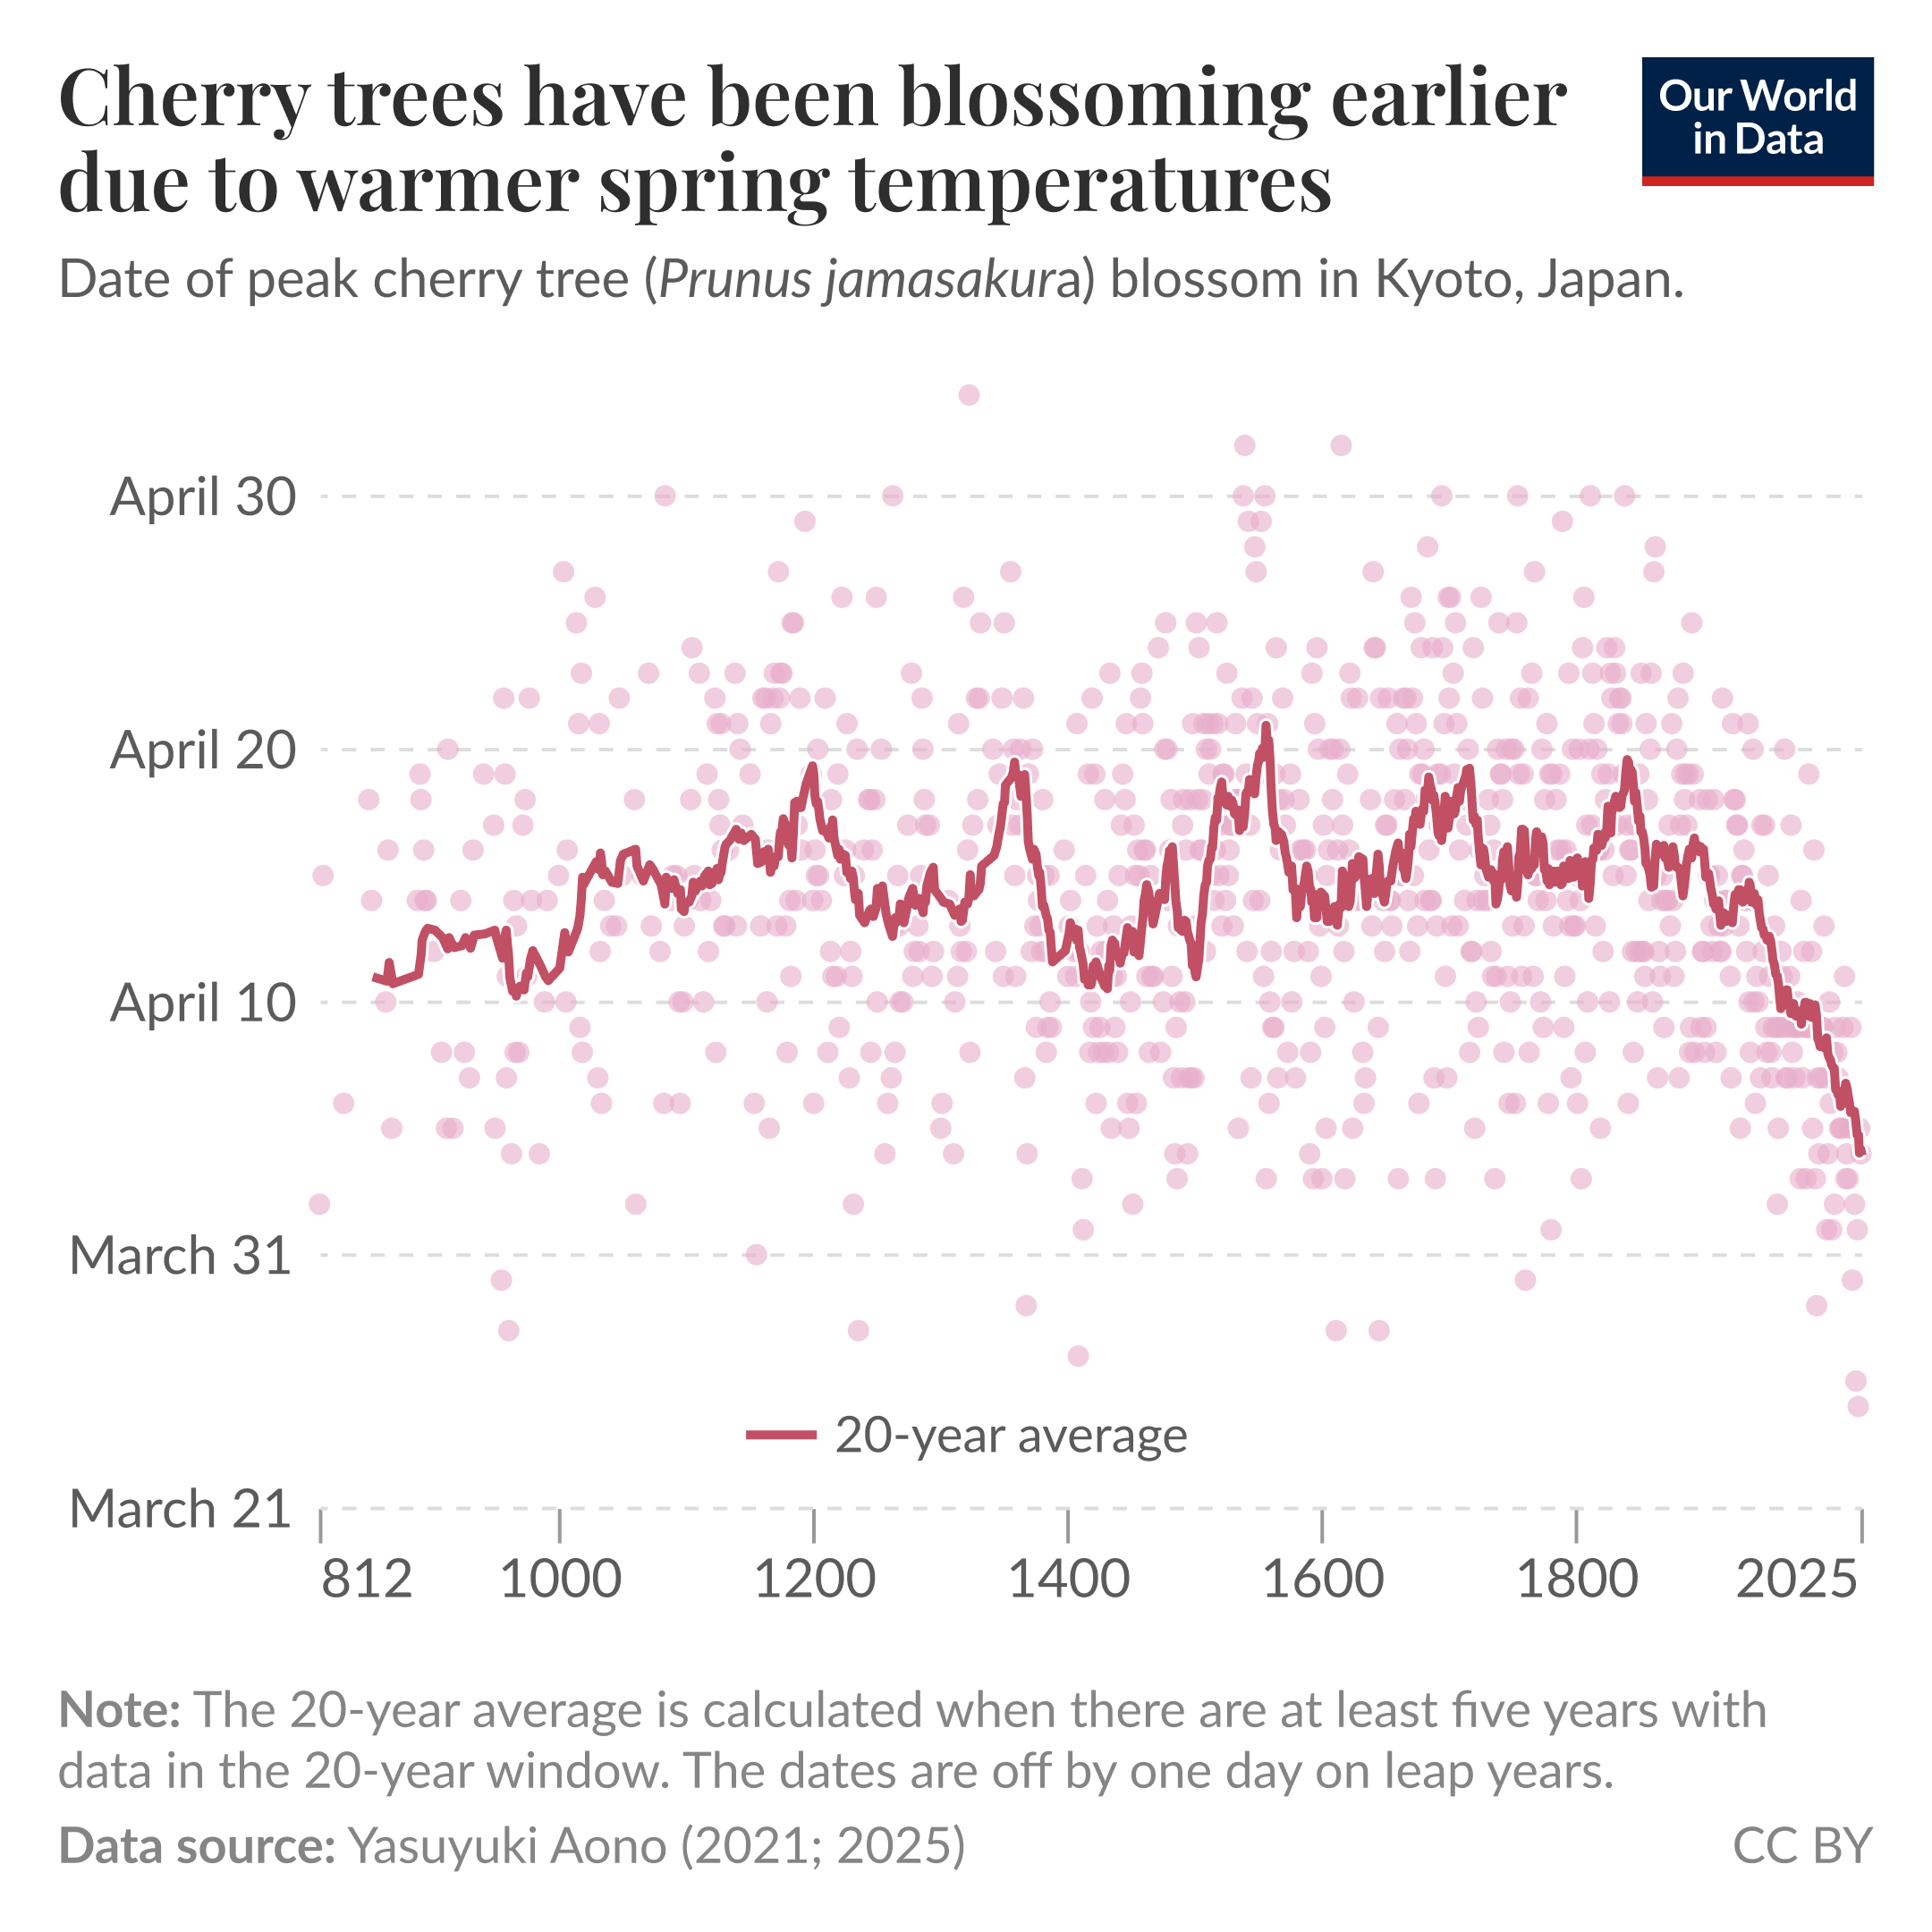
A proxy is an observable phenomenon that serves as an indirect indicator of past climate.
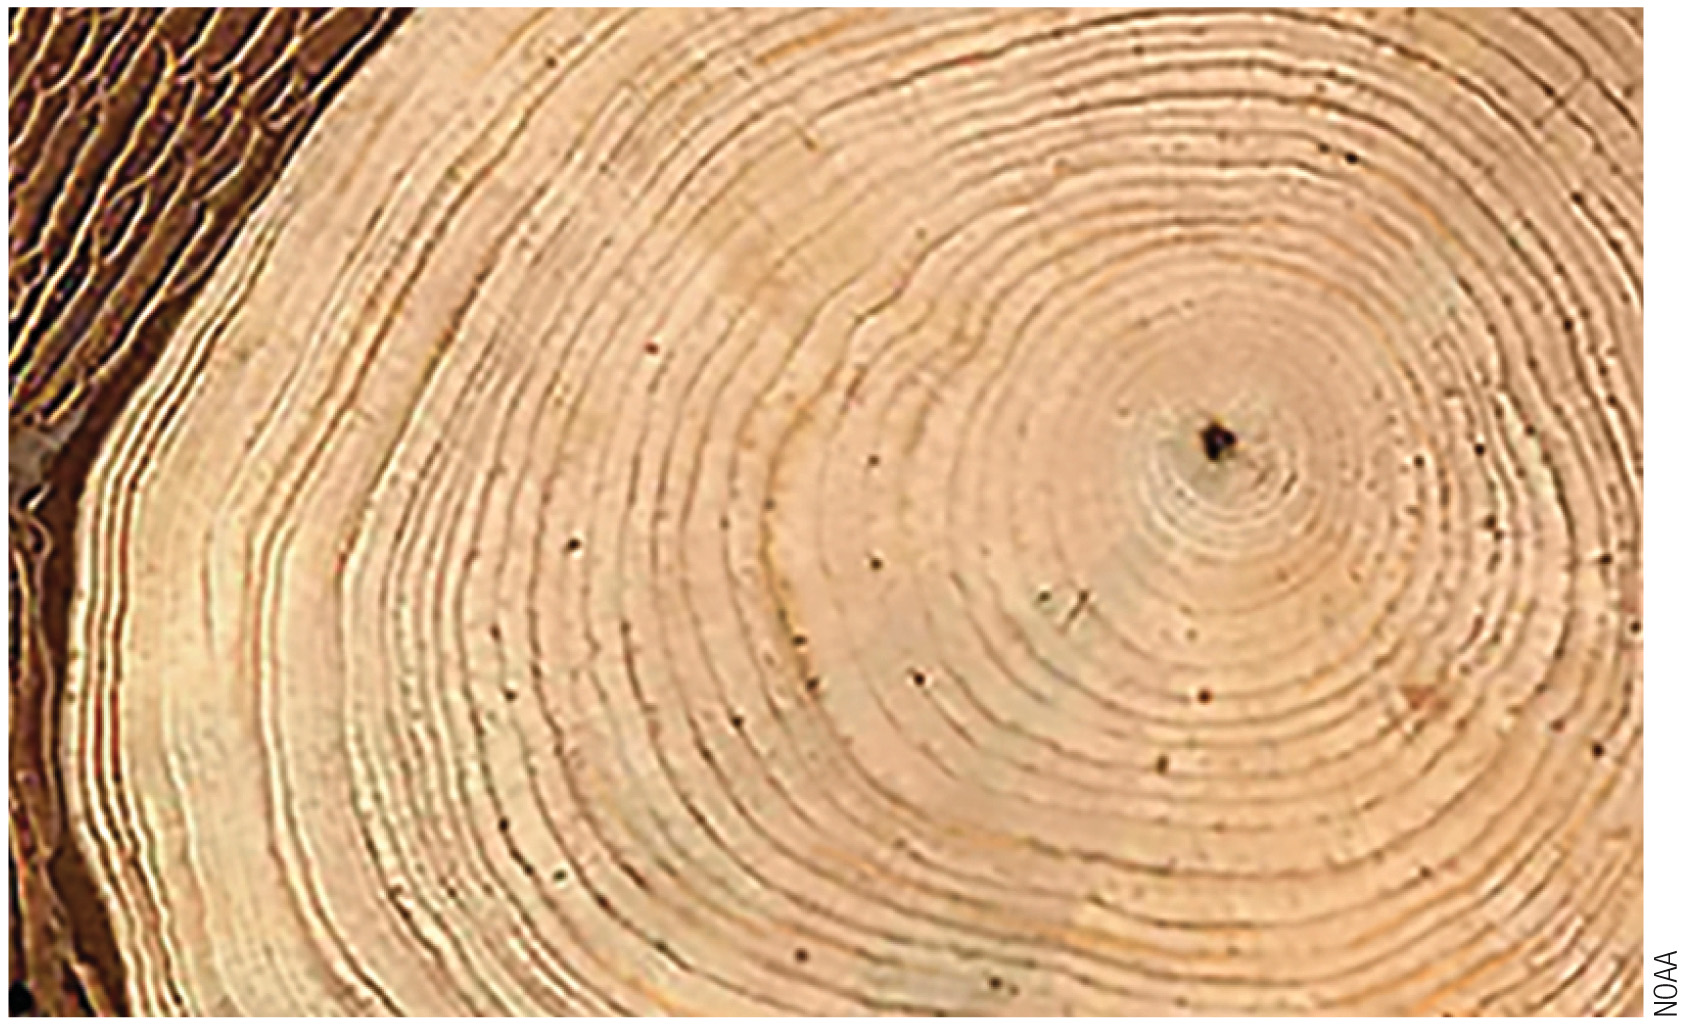
Fossil evidence of forested poles, 700-million-year-old tropical glaciers, and vast sea-level shifts reveal that Earth's climate has always changed, driven by forces very different from what we see today.
Continent positions alter solar radiation and ocean circulation. Mountain building draws CO₂ from the atmosphere via acidic rainfall.
Orbital shape (100k yr), axial tilt and direction (26–40k yr) alter solar input, pacing ice ages and warm interglacial periods.
Evolution of photosynthesizers, swamps, and forests has continuously altered atmospheric CO₂ and O₂ over geological time.
Krakatoa (1883) cooled Earth by a few tenths of a degree for several years. Siberian volcanism drove the Permian-Triassic mass extinction 252 million years ago.

Drag the slider on your laptop, then lock in. Answers are anonymous.
Change the carbon dioxide in the air, or remove every greenhouse gas, and watch the heat balance shift.
Illustrative equilibrium model, not a measurement of today’s temperature. Surface temperature uses the standard climate-sensitivity relationship ΔT ≈ 3°C × log₂(CO₂ / 280 ppm), anchored to a pre-industrial average of about 15°C (estimates range from about 14 to 15°C). With no greenhouse gases Earth would be about −18°C, roughly 33°C colder than that average (as the textbook notes). Warming per doubling of CO₂: IPCC AR6 likely range 2.5–4°C.
The IPCC's Sixth Assessment Report (Working Group I, 2021) declared that "It is unequivocal that human influence has warmed the atmosphere, ocean and land."
Through eight ice ages and warm periods, CO₂ stayed between about 170 and 300 ppm. In 2025 it reached 426 ppm, about 43% above the highest natural level, and nearly all of that rise came in the last 150 years.
Yearly CO₂ from burning fossil fuels and making cement grew from 6 billion tonnes in 1950 to 38.6 billion in 2024. About 58% of all the CO₂ released this way since 1750 was emitted in 1990 or later.
How much warmer each year has been than the late-1800s average.
Every year since 1930 has been warmer than the 1861–1890 average, and the 10 warmest years on record have all come since 2015. 2025 came in at +1.41 °C. One year above 1.5 °C does not break the Paris limit, which is measured over about 20 years.
Concentrations: WMO Greenhouse Gas Bulletin No. 21 (2024 data). Warming per tonne (GWP100) and lifetimes: IPCC AR6 WGI, Chapter 7.
Each step follows from the one before it. Click any statement to see the evidence.
Two suspects could heat Earth’s surface. Each one leaves a different fingerprint on the layers of the atmosphere. Which one matches the measurements?
More sunlight heats every layer, top to bottom.
Heat is trapped down low, while CO₂ high up sends more heat out to space, so the upper air cools.
Upper stratosphere: cooled 1–2°C (25–50 km up, 1986–2022). Troposphere: warmed.
Sources: Santer et al. (2023), PNAS 120(20), “Exceptional stratospheric contribution to human fingerprints on atmospheric temperature”; Manabe & Wetherald (1967), J. Atmos. Sci.; IPCC AR6 WGI, Chapter 3; NASA TSIS: the Sun’s output has not changed enough to explain the warming.
Yearly CO₂ from burning fossil fuels and making cement grew from 6 billion tonnes in 1950 to 38.6 billion in 2024. About 58% of all the CO₂ released this way since 1750 was emitted in 1990 or later.
Through eight ice ages and warm periods, CO₂ stayed between about 170 and 300 ppm. In 2025 it reached 426 ppm, about 43% above the highest natural level, and nearly all of that rise came in the last 150 years.
Every year since 1930 has been warmer than the 1861–1890 average, and the 10 warmest years on record have all come since 2015. 2025 came in at +1.41 °C. One year above 1.5 °C does not break the Paris limit, which is measured over about 20 years.
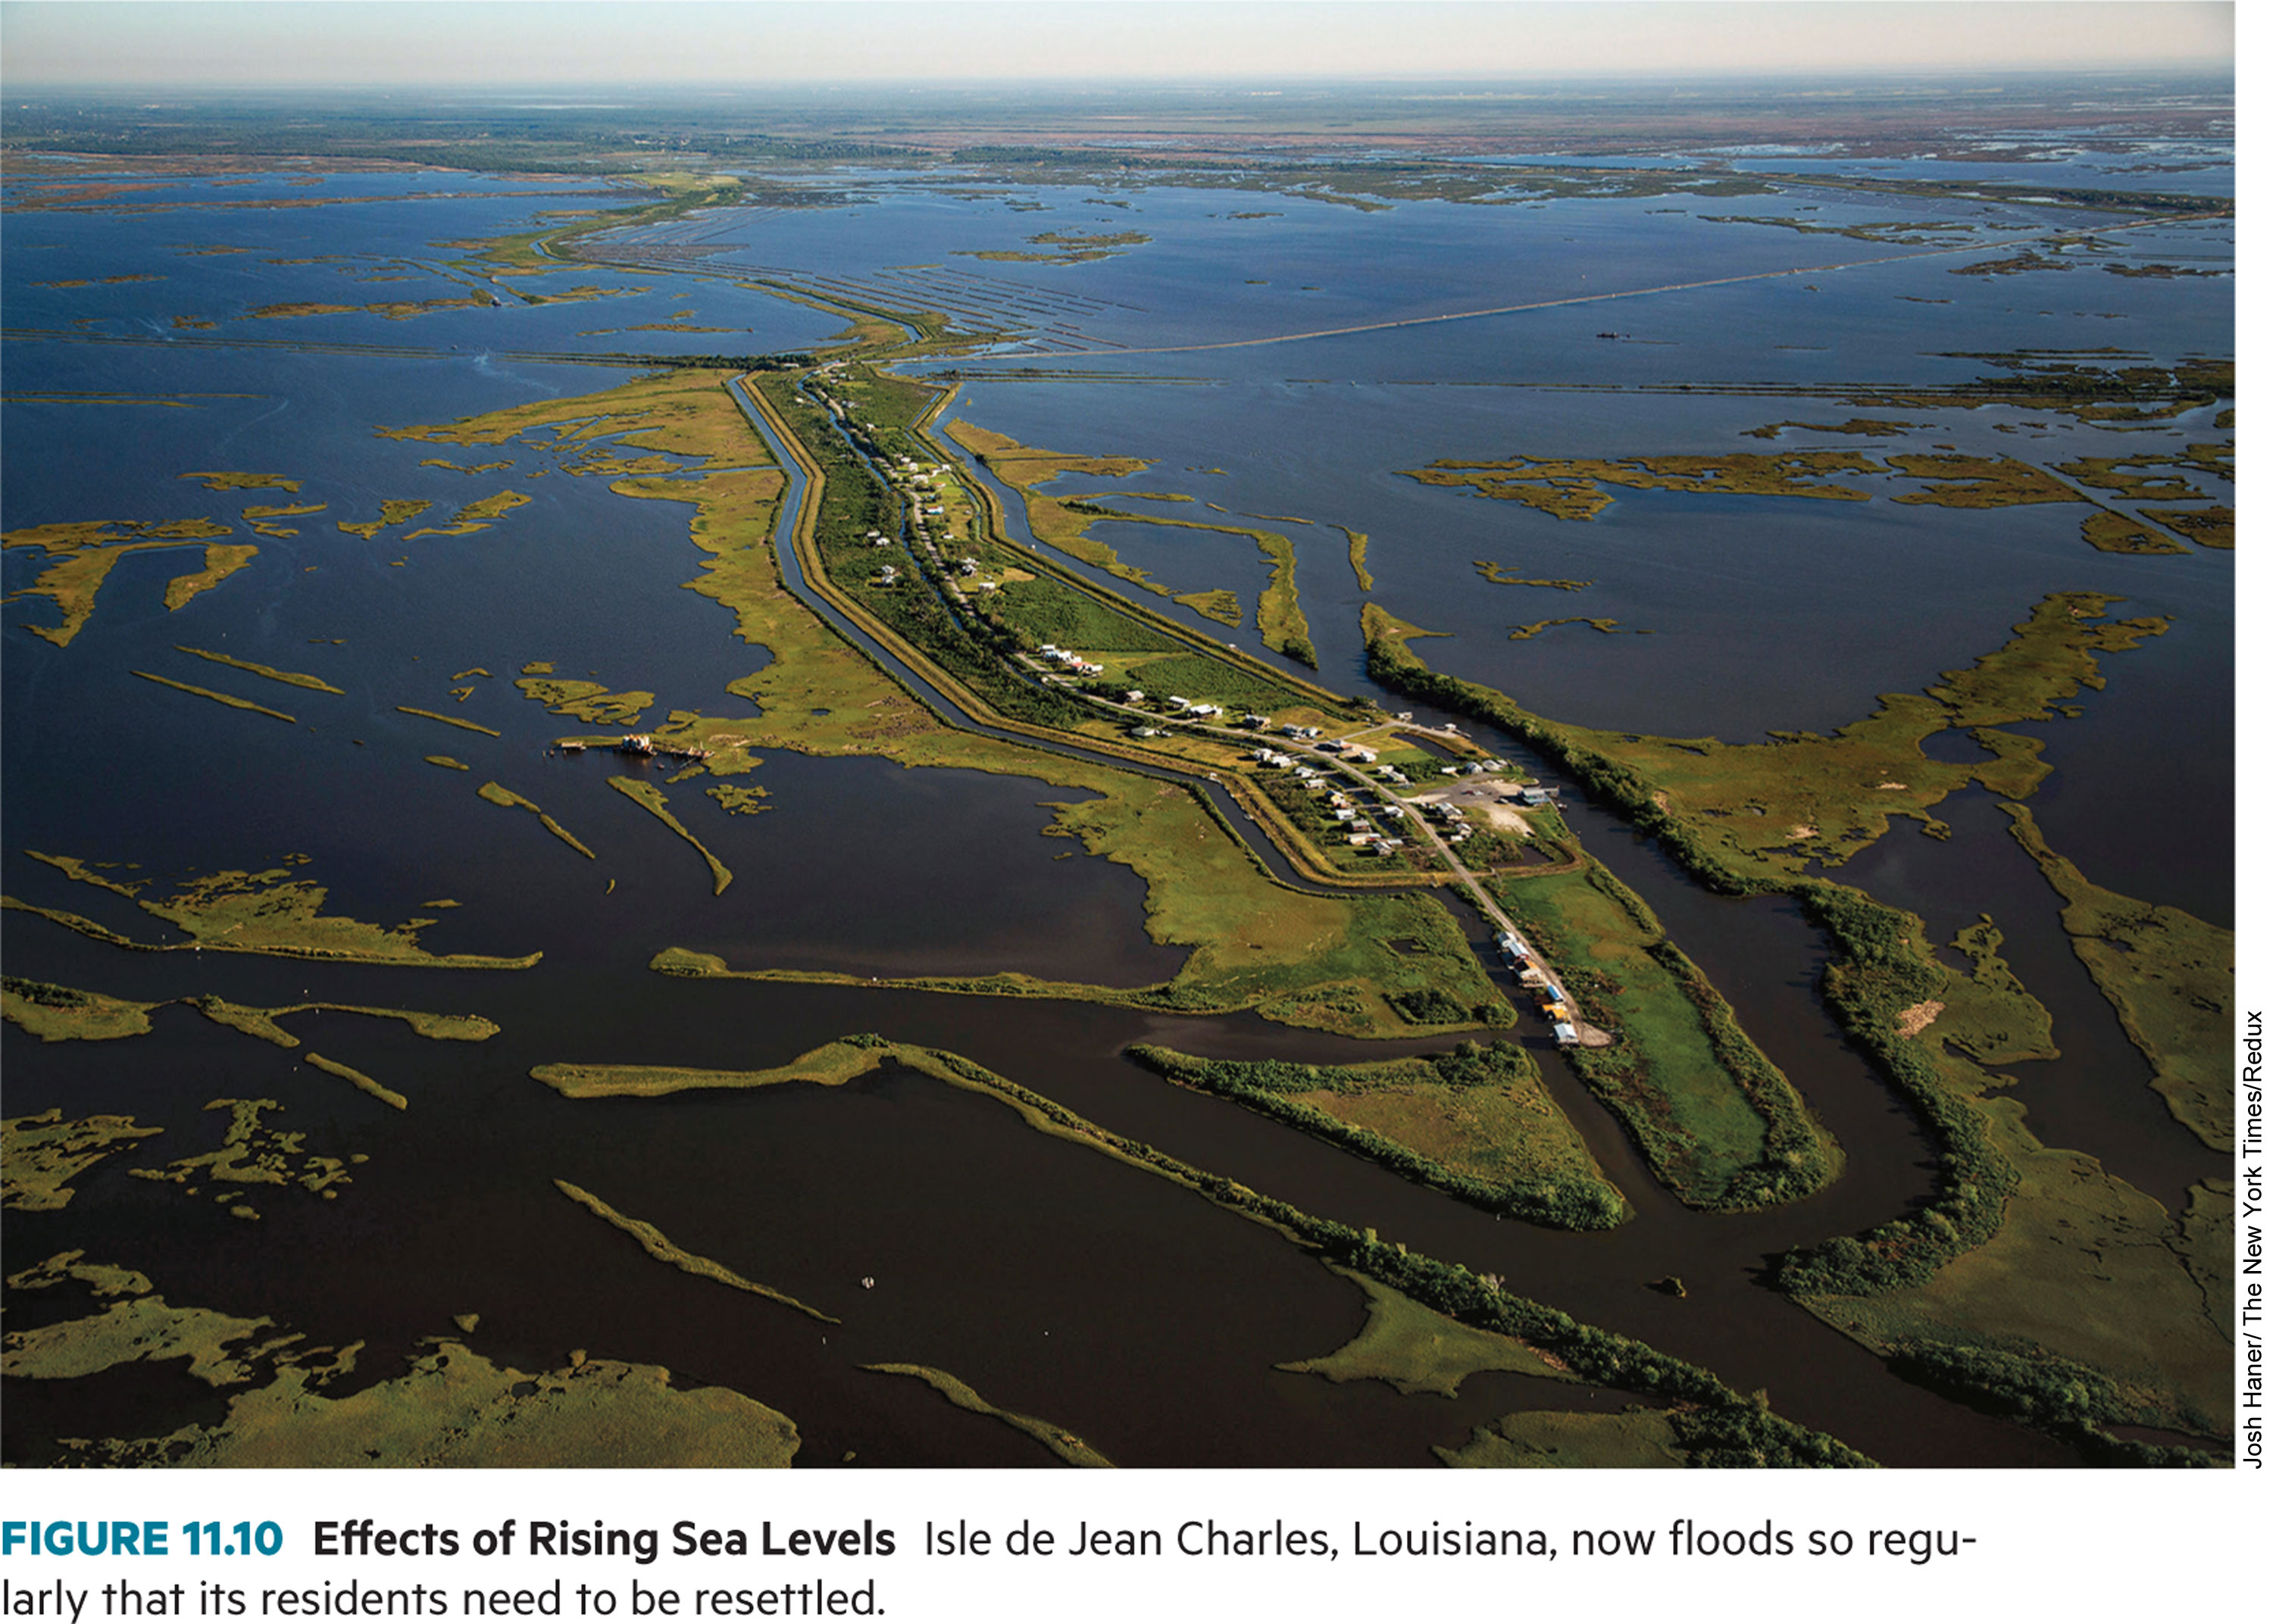
Coastal cities are at risk. Local sea level can rise faster or slower than the global average where the land sinks or rises.
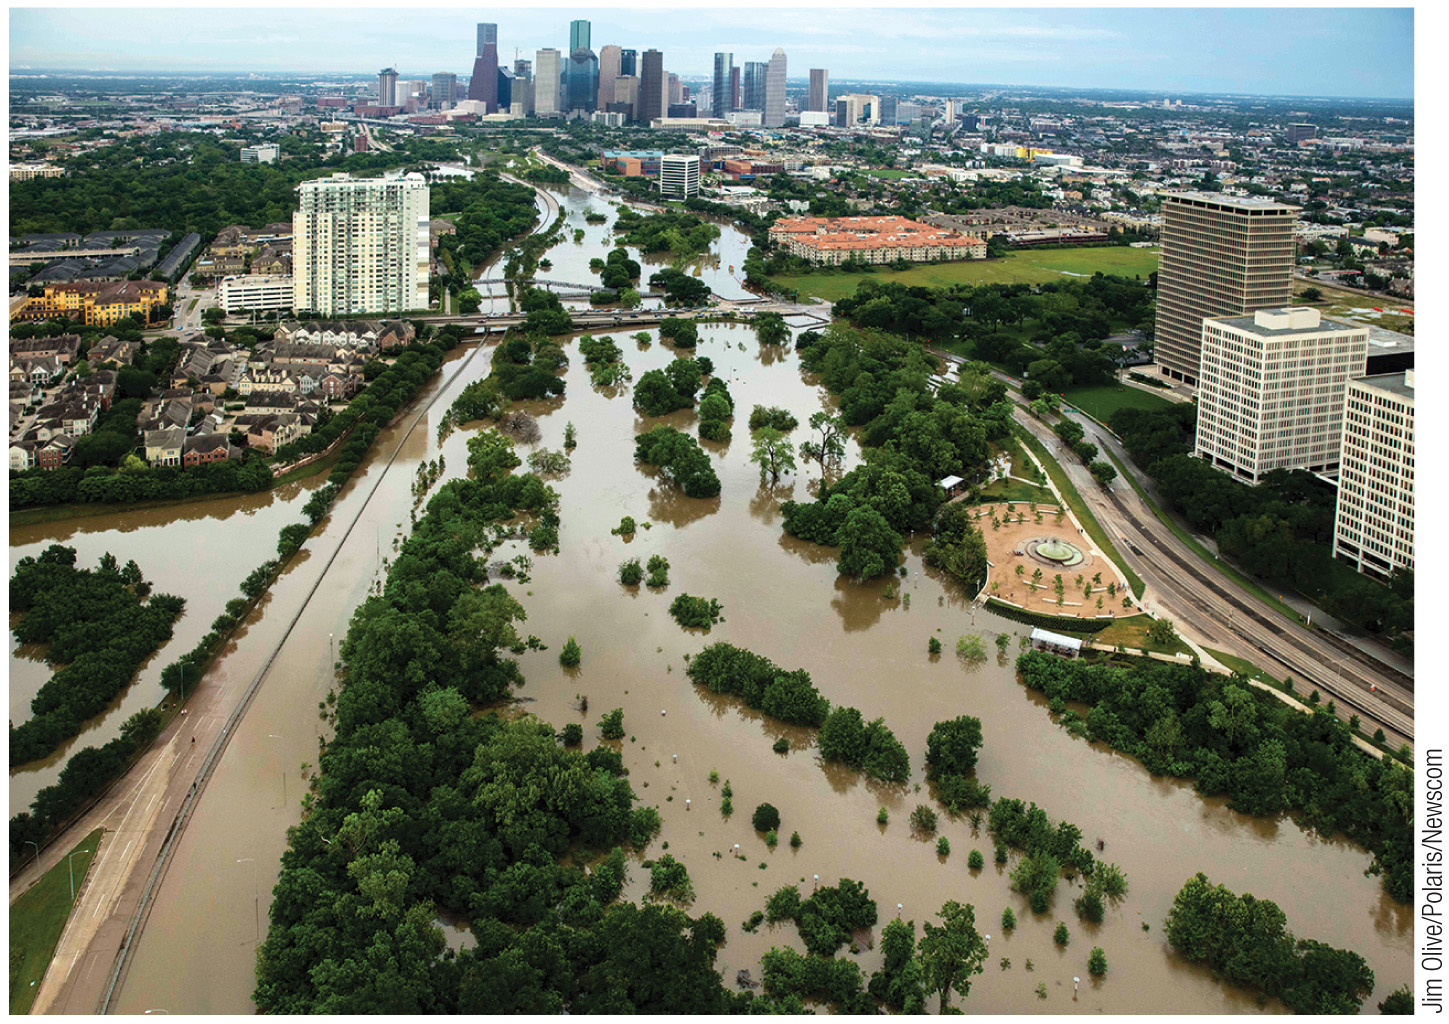
The National Climate Assessment predicts increasing hurricane intensity, especially in the Atlantic. Even as total storm counts may not always rise, the proportion of major (Category 3–5) hurricanes is growing. Thunderstorms, tornadoes, and winter storms are also affected.
9 of the 10 struck in 2004 or later. Part of the rise is exposure: more people and property now sit on the coast, and warmer oceans make the strongest storms stronger.
Estimated insured losses in billions of 2020 dollars, as ranked in 2020; later storms such as Ida (2021) and Ian (2022) are not included. Source: Insurance Information Institute, from Aon. Darker bars: 2004 or later.
Polar bears, coral reefs, and migratory species among most visible indicators of ecological change.

Falling ocean surface pH as seawater absorbs more CO₂.
Surface pH fell from 8.11 to 8.04 between 1989 and 2024. pH is logarithmic, so that drop means about 17% more hydrogen ions in the water. Seawater is still basic (above pH 7); it is becoming less basic as it absorbs CO₂.
High-income countries hold 15% of the world’s people but emit 34% of its CO₂. Low-income countries hold 9% of people and emit less than 1%.
Death rates from these disasters were 15 times higher in highly vulnerable regions. About 3.3 to 3.6 billion people live in places highly vulnerable to climate change, with hotspots in West, Central and East Africa, South Asia, Central and South America, small island states and the Arctic.
Hotter, poorer countries have lost the most, while some cooler, wealthy countries may have gained. For most poor countries there is a greater than 90% chance that income per person is lower today than it would have been without global warming.
Two price tags per tonne: cutting greenhouse gases, and the damage carbon dioxide does.
The IPCC assessed enough cuts to halve global emissions from their 2019 level by 2030. More than half of that potential costs under $20 a tonne (solar, wind, efficiency, stopping methane leaks); all of it costs $100 a tonne or less, and some of it saves money.
Lost lives from heat, lower crop yields, energy costs and sea-level rise, added up over the tonne’s lifetime (2020 dollars, 2% near-term discount rate). 5th–95th percentile range: $44 to $413. Even $44 is more than double the cost of over half of the cuts.